Finding a needle in a Storm-stack
(Crossposting from Outbrain's techblog)
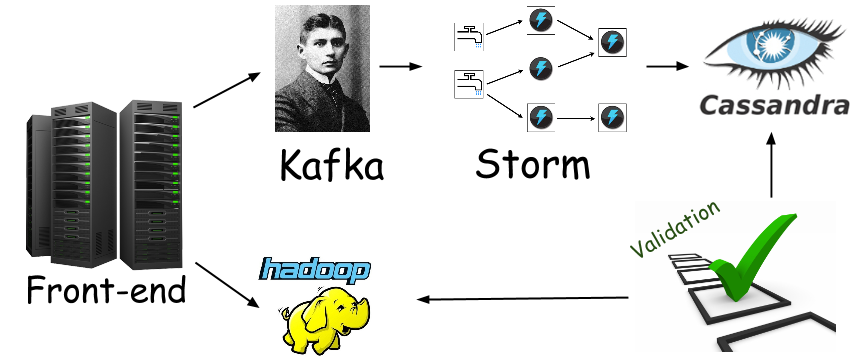
Using Storm for real time distributed computations has become a widely adopted approach, and today one can easily find more than a few posts on Storm's architecture, internals, and what have you (e.g., Storm wiki, Understanding the parallelism of a storm topology, Understanding storm internal message buffers, etc).
So you read all these posts and and got yourself a running Storm cluster. You even wrote a topology that does something you need, and managed to get it deployed. "How cool is this?", you think to yourself. "Extremely cool", you reply to yourself sipping the morning coffee. The next step would probably be writing some sort of a validation procedure, to make sure your distributed Storm computation does what you think it does, and does it well. Here at Outbrain we have these validation processes running hourly, making sure our realtime layer data is consistent with our batch layer data - which we consider to be the source of truth.
It was when the validation of a newly written computation started failing, that we embarked on a great journey to the land of "How does one go about debugging a distributed Storm computation?", true story. The validation process was reporting intermittent inconsistencies when, intermittent being the operative word here, since it was not like the new topology was completely and utterly messed up, rather, it was failing to produce correct results for some of the input, all the time (by correct results I mean such that match our source of truth).
Looking back, our endeavor to solve the problem consisted of the following steps and milestones:
This framework really shined as we were able to produce a test that failed on the sample data we'd collected. Enter the debugging stage, with IntelliJ, breakpoints, and all the happy stuff we love and cherish. A few days into debugging we found some issues and fixed them, thinking it would do the trick since the test we crafted was no longer failing.
It was a bit surprising to learn our validation process kept failing after we had deployed the patched topology, oh well, c'est la vie.
Having added additional logging we were looking to catch the bug red handed in production. The thing was, due to the batchy nature of the existing validation cycles, they were running with about a couple of hours latency compared to realtime, so each code change took about 2-3 hours to take effect, which made the whole trial and error style of work we'd adopted at that stage quite frustrating and very ineffective.

To make the validation cycles shorter an ad-hoc validation procedure (i.e. one that would run on demand) was devised, with the following scripts in its foundation:

The new ad-hoc validation cycle reduced the iteration time from 2-3 hours down to about 10-15 minutes at most, cowabunga!
It figures that the one thing we'd mocked in our tests, and didn't really cover - had a bug in it.
Well, one of the very few things, but the former sounds better and has a deeper meaning to it.
Using Storm for real time distributed computations has become a widely adopted approach, and today one can easily find more than a few posts on Storm's architecture, internals, and what have you (e.g., Storm wiki, Understanding the parallelism of a storm topology, Understanding storm internal message buffers, etc).
So you read all these posts and and got yourself a running Storm cluster. You even wrote a topology that does something you need, and managed to get it deployed. "How cool is this?", you think to yourself. "Extremely cool", you reply to yourself sipping the morning coffee. The next step would probably be writing some sort of a validation procedure, to make sure your distributed Storm computation does what you think it does, and does it well. Here at Outbrain we have these validation processes running hourly, making sure our realtime layer data is consistent with our batch layer data - which we consider to be the source of truth.
Looking back, our endeavor to solve the problem consisted of the following steps and milestones:
- Getting sample input data, for which the computation fails to produce correct results
- Reproducing the bug on a local cluster
- Adding extensive flow-level logging to the topology components
- Shorting the validation cycle
- Digging through production logs
Getting sample input data
Since we are using the oh-so-common Kafka-Storm duo, getting the input data is straight forward, and pretty much sums up to bringing up a (console) consumer that simply writes its input to a file. However, one must take the data volume into consideration, we can not just write the entire input stream to a file since it peaks at ~50,000/sec messages which is ~10M/sec worth of raw data, and would make files impractical to work with in terms of sheer size. This is where the validation process came in handy once again, since it was broken down to per-business entity validation, we could use the information pertaining to entities that had the highest inconsistency ratio, and filter the sample data accordingly. This filtering resulted in a more or less reasonably sized file.Reproducing the bug on a local cluster
Back when we were developing our topologies, a considerable effort was put into making them testable. We've came up with a pretty extensive end to end testing framework, which brings up topologies and feeds them production like data it reads from files. A thing worth noting is that we don't write to the actual persistent storage in these tests, but rather mock them with in-memory objects. We then assert these mocks "store" what we expect them to.This framework really shined as we were able to produce a test that failed on the sample data we'd collected. Enter the debugging stage, with IntelliJ, breakpoints, and all the happy stuff we love and cherish. A few days into debugging we found some issues and fixed them, thinking it would do the trick since the test we crafted was no longer failing.
It was a bit surprising to learn our validation process kept failing after we had deployed the patched topology, oh well, c'est la vie.
Adding extensive flow-level logging
Ever since the lighthouse test had ceased failing, we were in a somewhat disturbing position of not having a way to reproduce the faulty behavior on a local cluster. "When in doubt, f*ck!" (Al Pacino, Scent of a Woman [1992]), armed with Al's advice we started adding (application) flow level logs to the topology at hand. The flow level part was crucial here, and meant the information logged had to be sufficient to allow tracing individual requests throughout the entire topology. In practice, it may be a good idea to log business level identifiers that can be used for correlating requests along the flow, before, and after each component in your topology. Anything goes, bolts that perform aggregations, bolts that persist to storage, and even spouts, if you have reasons to believe they're acting fishy. Just as with the sample data, and for the same reasons, we had to make do with applying the elaborate logging partially, only on the part of the input that contained the business entities we suspected to most likely trigger the bug.Having added additional logging we were looking to catch the bug red handed in production. The thing was, due to the batchy nature of the existing validation cycles, they were running with about a couple of hours latency compared to realtime, so each code change took about 2-3 hours to take effect, which made the whole trial and error style of work we'd adopted at that stage quite frustrating and very ineffective.
Shortening the validation cycles
When looking for a way to make the testing iterations shorter, we realized the great latency stemmed from our source of truth - the batch layer, which was based on the hadoop/hive stack. Since shortening the batch processing was out of our scope, we decided to slightly shift (see below) the source of truth towards Kafka. We felt pretty comfortable doing so since we had already verified messages were arriving to Kafka just fine, which indicated the problem lied elsewhere, probably in the topology itself.- A consumer that writes filtered input data to a file (filtered according to the business entities we'd chosen) impressions_srcId_wgtId_filter is a Python code that gets a line of tab delimited values (in our case, could be any other delimiter) from standard input and emits it to the standard output only if its value(s) match the ids specified via command line arguments.
- A script that takes the filtered input data file, mimics the aggregations done by the original topology (using a neat CLI tool called q), and writes the results to yet another file. q allows one to write SQL like queries over Unix file streams. In the example below we're rounding timestamps to 15 second long windows, from TIME_STAMP_A to TIME_STAMP_B. "C1" denotes the first column in the file, "C17" the 17th column of the file and so forth. q also supports aggregation functions, which makes it very useful when it comes to basic crunching of small to medium delimiter separated (Unitx) streams of values. For example:
- A script that takes the results of the mimicked aggregations, and compares them to the topology's results (which are persisted to the data storage in realtime and thus queryable). This part essentially consists of doing the dirty work of parsing and manipulating the files from steps (1) and (2), the data is there, it's just a matter of scripting the sense out of it.
Epilogue
With the fast ad hoc test iterations and detailed logging we were able to figure out our persistence bolt had multiple instances running, overriding each other's values in the persistent storage. Such a scenario can be addressed by a more careful group shuffling or ensuring a single persistence bolt instance, but hey, these are implementation details.It figures that the one thing we'd mocked in our tests, and didn't really cover - had a bug in it.
Well, one of the very few things, but the former sounds better and has a deeper meaning to it.

Comments
Post a Comment